Despite significant investment into UK mobile networks, current regulatory frameworks hold back UK connectivity from competing with world’s best.
Faster speeds and fewer connectivity not spots would be just two areas of significant potential available to the UK if its mobile market was on a level playing field with other countries.
New findings from VodafoneThree’s Mobile Market Index, a global study across 10 markets in Europe, the US and Asia, has found that:
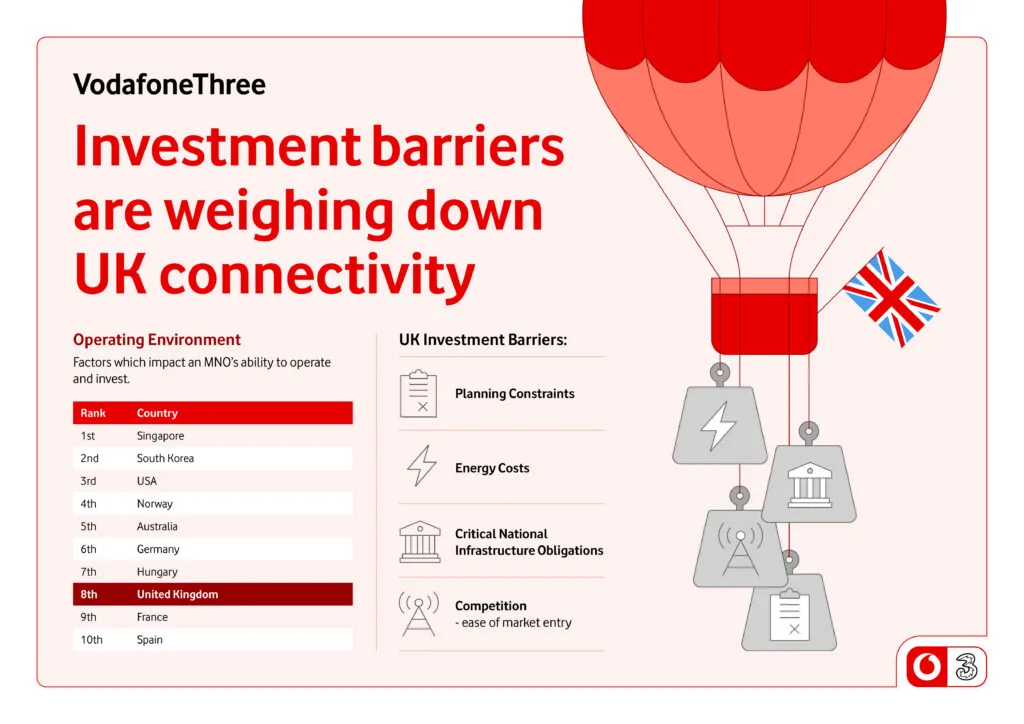
- The UK ranks eighth out of 10 countries for the competitiveness of its operating environment for Mobile Network Operators (MNOs), behind countries like Singapore, South Korea, the US, Germany and Australia.
- The UK struggles to match other countries due to higher energy costs; an emerging retirement gap for engineers threatening the workforce needed for delivery; restrictive regulatory policy; high spectrum charges and an increasingly competitive Mobile Virtual Network Operator (MVNO) market.
- These combined pressures translate into a challenging picture for network quality with the UK coming ninth out of 10 countries on this measure.
Despite these pressures, VodafoneThree and other UK MNOs have made substantial progress in improving the UK’s mobile networks.
In the first year since the VodafoneThree merger, 16,500km² of mobile not spots have been eliminated, with up to 28.6 million Vodafone and Three customers now automatically connecting to the best available coverage, at no extra cost.
At the same time, combined spectrum sharing has opened up access to VodafoneThree’s fastest 5G speeds, bringing enhanced connectivity to up to 50 million people across the UK.
However, with mobile networks becoming a key front line in the UK’s resilience and a driver of economic opportunity in every community, this investment needs to come alongside a step change in the regulatory frameworks which Mobile Network Operators work within.
The Index shows that challenges in the operating environment for MNOs, high energy and property costs, infrastructure obligations and planning friction translate into suboptimal outcomes for the UK in relation to performance on download speeds, 5G coverage and connection quality, with those metrics trailing nearly every peer.
The analysis supports the conversation the Government has started with the Mobile Market Review with the aim of identifying and removing barriers currently holding back mobile operators from creating the conditions for long-term investment in the UK’s digital infrastructure.
“Since the merger we have raised the bar for connectivity in the UK, eliminating thousands of not spots and providing millions of people with access to our fastest 5G speeds.But we cannot afford to lose momentum. Fast, reliable and quality mobile networks are a fundamental driver of economic growth and prosperity. Which is why we support the UK Government’s efforts to examine the barriers holding back our mobile networks. Bringing the UK’s investment environment up to the standard of our international peers could help to support public services, eliminate digital divides and enable communities to thrive.”
Andrea Donà, Chief Network Officer, VodafoneThree
Energy costs and planning delays slow progress
The Index reveals that UK operators face the second highest energy costs and planning red tape, while the UK is ranked seven out of 10 for the pipeline of relevant skills.
The cumulative impact of these pressures affects the service MNOs are able to provide the UK in comparison to other countries. The current environment limits operators’ ability to monetise the full extent of their network and invest sustainably in the digital infrastructure the UK needs to meet the demands of the future.
Without action to support investment into UK networks, the Index suggests that the UK risks falling behind its global peers in supporting digital public services, national resilience and economic growth.
The Index argues that affordability and competition should remain central, but they need to sit alongside a stronger focus on investment, resilience, security and advanced network capability. VodafoneThree would like to see three policy changes resulting from the Mobile Market Review:
- Planning reform: We need to modernise the planning system for the era of 5G connectivity and speed up advanced network roll outs.
- Energy reform: MNOs are providers of always-on critical national infrastructure, without the mitigation on energy costs that other sectors receive.
- Enabling 5G slicing technology: The UK is an outlier on 5G regulations, with significant barriers to using network slicing technology to boost speed and bandwidth where and when customers need it.
-Ends-
Notes to Editors:
About the Mobile Market Index
The Mobile Market Index (MMI) provides a comprehensive assessment of the operating environment for Mobile Network Operators (MNOs) in the UK, benchmarked against comparable markets across the globe. It is built on a clear split: four pillars capture the inputs (the conditions operators and investors face) and one captures the outputs (what consumers and the market experience). This structure means inputs help explain outputs, rather than being blended into a single league-table number. By establishing the relationship between regulatory frameworks, market structures, and network performance, the Index demonstrates that the challenges facing MNOs translate into suboptimal experiences for UK consumers. Every score is relative, reflecting standing within this group of ten rather than an absolute benchmark.
Countries: Ten in total: the United Kingdom (the focus country) plus the United States, Germany, France, Spain, South Korea, Australia, Norway, Singapore and Hungary. The group spans a range of market sizes, regulatory approaches and economic contexts, and has been selected for its relevance to UK mobile market policy: large G7 economies (USA, Germany, France), European mid-sized peers (Spain, Hungary), advanced network leaders (South Korea, Singapore), and structurally informative comparators (Australia, Norway).
Pillars and metrics: Five pillars hold 31 metrics in total. The majority are hard quantitative measures (coverage, price per GB, energy costs); two regulatory metrics (network slicing and recurring spectrum charge burden) are constructed indices scored on a defined 1 to 3 scale; and three metrics within the Property & Planning pillar draw on World Bank Enterprise Survey data, reflecting firm-reported experience rather than administrative records.
Why do we use ITU data?
We use ITU data because it is the leading global source of telecoms statistics, covering around 200 economies and providing standardised, independently validated data specifically designed for international benchmarking and cross-country comparison.
Why is 5G coverage from 2023?
5G coverage is sourced from the ITU’s international statistics database, which is the standard source for internationally comparable telecoms data. We use 2023 because it is the most recent year for which the ITU has complete, validated 5G coverage data across all ten benchmark countries, ensuring a fair like-for-like comparison.
Why is Capex per Capita from 2022?
Capex per Capita is also sourced from the ITU, providing a consistent basis for international comparison. Because financial indicators based on operator disclosures take longer to compile and validate than coverage metrics, 2022 is the latest year with complete, comparable ITU data across all ten benchmark countries.
Response on Price per GB
Price per GB is not intended to be a standalone measure of market performance; it is used as a standard affordability indicator. It provides a consistent way to compare the cost of mobile data across countries by relating price to the amount of data included in a plan. While factors such as FWA adoption, usage patterns and tariff structures can influence the result, the metric remains widely used in international benchmarking because it captures the relative affordability of data for consumers on a like-for-like basis